Introduction
As I suggested in my previous blog, visualizing graphs is hard. In the previous blog I took the approach of using a few visual tricks to display graph information in roughly sequential manner. Another option is to convert the graph to a hierarchical display. This is easy if you have a tree as hierarchical clustering or maximal entropy trees will do.
Maximal Entropy Graphs
However, our data is rarely hierarchical and so I've attempted to extend maximal entropy trees to graphs. First, it starts with the assumption that some type of weight exists for the nodes. However, this can simply be uniform across all nodes. This weight is effectively the amount of information the node contains. As in the last blog, this could be scored relative to a specific node in the graph or about any other way. It then combines nodes along edges, attempting to minimize the amount of information contained in any aggregated node. It continues this approach until it gets to the desired number of nodes, however it keeps a history of every change so that any node can be de-aggregated.
You can find the code in this Github GIST. You can then try it out in This Jupyter Notebook.
Ultimately, it takes a graph like this:

and produces one that looks like this:
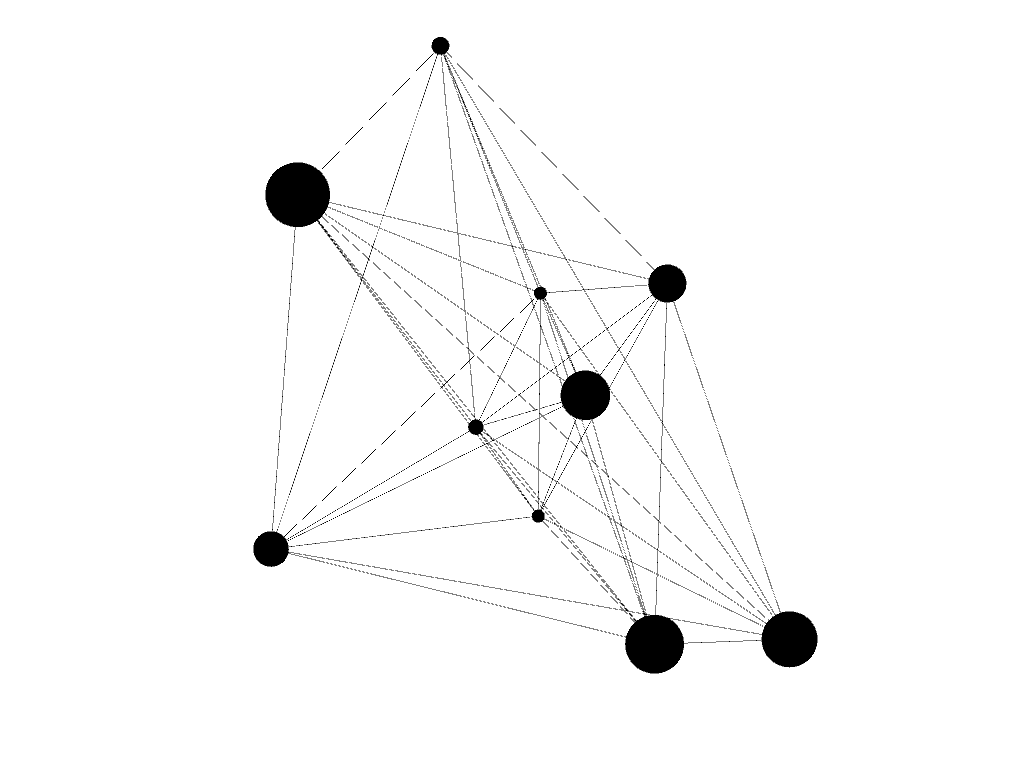
Each node still contains all the information about the nodes and edges it aggregates. This allows an application to dig down into a node as necessary.
Future Work
Obviously there's a lot to do. This is less a product in and of itself than a piece for making other graph tools more useful. As such, I should probably wrap the algorithm in a visualization application that would allow calculating per-node scores as well as diving in and out of the sub-graphs contained by each node.
Also, a method for generating aggregate summarizes of the information in each node would be helpful. For example, if this is a maltego-type graph and a cluster of IPs and Hosts, it may make sense to name it a IP-Host node with a number of IP-Host edges included. Alternately, if a node aggregates a path from one point to another through several intermediaries, it may make sense to note the start and endpoint, shortest path length, and intermediary nodes. I suspect it will take multiple attempts to come up with a good name generation algorithm and that it may be context-specific.
Conclusion
In conclusion, this is another way of making otherwise illegible graphs readily consumable. Graphs are incredibly powerful in many contexts including information security. However methods such as this are necessary to unlock their potential.
No comments:
Post a Comment